
The Numbers Don’t Lie: 6 Steps To Prove Content Works

Introduction
Ever feel like you’re shouting into the void with your content? You’re not alone.
The task to prove content works is a challenge many marketers face. For many it takes a lot of time and insight collate and interpret the necessary data.
This guide will show you 6 key steps to take that prove content effectiveness. No guesswork. Just hard data.
We’ll cover everything from setting up measurement systems to calculating ROI. By the end, you’ll have concrete ways to show your content’s impact.
Ready to turn your content efforts into measurable success? Let’s dive on in into the numbers.
Step 1: Set Up Content ROI Measurement Systems
TL;DR:
- Choose the right analytics tools to help you prove content works
- Set clear, measurable content goals
- Establish baseline metrics for comparison
Choose Your Content Analytics Tools
Selecting the right analytics tools is crucial for measuring your content’s return on investment (ROI). Start with these steps:
- Identify your needs: List what you want to track. This might include website traffic, user behaviour, or social media engagement.
- Research available tools: Look into popular options like Google Analytics, SEMrush, or Ahrefs. Each has unique features.
- Compare features: Make a spreadsheet. List tools in columns and features in rows. Check off what each offers.
- Consider your budget: Many tools have free versions. Paid versions often offer more in-depth data.
- Test before committing: Most paid tools offer free trials. Use them to see which fits your needs best.
Integrating Tools with Your Content Management System (CMS)
Once you’ve chosen your tools, integrate them with your CMS:
- Find the integration instructions: Look in your CMS’s documentation or the analytics tool’s help centre.
- Get the tracking code: Your chosen analytics tool will provide a unique code snippet.
- Add the code to your site: In most CMS platforms, you can add this code in the header section of your theme or via a plugin.
- Test the integration: Use your analytics tool’s real-time reports to confirm it’s capturing data.
- Set up filters: Exclude internal traffic to keep your data clean.
Define Your Content Goals
Clear goals are essential for measuring content ROI. Here’s how to set them:
- Align with business objectives: Your content goals should support overall business aims. If your business goal is to increase sales by 20%, your content goal might be to generate 30% more leads.
- Make goals SMART: Specific, Measurable, Achievable, Relevant, and Time-bound. Instead of “increase traffic,” try “increase organic traffic by 25% in the next quarter.”
- Consider different goal types:
- Awareness goals: Increase brand recognition
- Engagement goals: Boost time on page or social shares
- Conversion goals: Generate more leads or sales
- Document your goals: Write them down and share with your team.
- Review regularly: Goals should be flexible. Review and adjust quarterly.
Examples of SMART Content Goals
- Increase email newsletter sign-ups by 15% in the next 3 months
- Achieve a 10% higher average time on page for blog posts by the end of Q2
- Generate 20 qualified leads per month from gated content by year-end
Establish Baseline Metrics
Benchmarking current performance is crucial. It allows you to measure progress and prove ROI. Here’s how to do it:
- Identify key metrics: Based on your goals, decide which metrics matter most. These might include:
- Traffic: Unique visitors, pageviews
- Engagement: Time on page, bounce rate
- Conversions: Lead generation, sales
- Gather historical data: Collect at least 3-6 months of data for each metric. This accounts for seasonal fluctuations.
- Calculate averages: Find the mean performance for each metric over your chosen time period.
- Document your findings: Create a spreadsheet or dashboard with your baseline metrics.
- Set realistic targets: Use your baselines to set achievable improvement goals.
Organising Your Baseline Data
Create a simple table like this:
| Metric | Baseline (6-month average) | Target (6 months from now) |
|---|---|---|
| Unique visitors | 10,000 | 12,500 |
| Avg. time on page | 2:30 | 3:00 |
| Lead conversions | 50 | 75 |
This organization helps you track progress clearly.
By setting up these systems, you’re laying the groundwork for measuring your content’s effectiveness. You’ll be able to track progress, identify what’s working, and prove the value of your content efforts.
“Sometimes, there are still gaps in the data where it’s just not possible to see the immediate impact of certain metrics on core objectives. But don’t let that hold you back. Instead, get to better measurement using proxy metrics, or key directional indicators.” – Karen Sauder, Google Large Customer Solutions VP
This quote underscores the importance of using available data, even if it’s not perfect. Proxy metrics can provide valuable insights when direct measurement isn’t possible.
Remember, setting up these measurement systems isn’t a one-time task – it’s an ongoing approach. Especially as technology continues to move on, there are increasingly new metrics and efficiencies for you to keep an eye out for. Regularly review and refine your approach to ensure you’re capturing the most relevant data for your content strategy.
Step 2: Identify Key Performance Indicators to Prove Content Works
- Learn essential metrics for to prove content works
- Understand how to track and improve key performance indicators
- Discover tools for setting up effective content analytics
Traffic Metrics
Traffic metrics are fundamental indicators of your content’s reach and visibility. They provide insights into how many people are finding and accessing your content.
Unique Visitors
Unique visitors represent the number of individual users who have viewed your content within a specific time frame. This metric helps gauge the size of your audience and the effectiveness of your content distribution strategies.
To track unique visitors:
- Set up GA4 on your website. It’s free and the most commonly used tool.
- Navigate to the “Acquisition” section
- Select “Overview” to view unique visitor data
Pageviews
Pageviews indicate the total number of times your content pages have been loaded. This metric can help you identify your most popular content and understand user behavior on your site.
To track pageviews:
- In Google Analytics, go to “Engagement”
- Select “Pages and screens”
- Choose “All Pages” to see pageview data for individual content pieces
Engagement Metrics
Engagement metrics provide deeper insights into how users interact with your content, helping you understand its effectiveness in capturing and maintaining audience interest. The rule of thumb here is simple, the higher the engagement – the better your content is doing at serving it’s purpose.
Engagement Time
Engagement time measures the duration users actively interact with your content, such as scrolling, clicking, or highlighting text. This metric offers a more accurate picture of content consumption than simple time on page.
“Engagement time is a critical metric for understanding not just how long users stay on a page, but how they interact with the content,” says Tom Whatley of Grizzle. “We measure organic traffic, keyword rankings, and time on page for our content.”
Engagement rate calculates the percentage of users who interact with your content in some way. This can include actions like commenting, sharing, or clicking on links within the content.
Scroll Depth
Scroll depth measures how far users scroll through your content, indicating how much of it they’re actually consuming. In GA4 the out the box metrics to look for is Scrolled users, which tracks any user who consumes 90% of the page.
You can get more in depth though with Google Tag Manager. To track scroll depth:
- Use Google Tag Manager to set up scroll depth tracking
- Configure Google Analytics to receive this data
- Analyse scroll depth in the “Events” column of Google Analytics 4
According to a study by Chartbeat, only 50% of users scroll beyond the halfway point of an article.
Conversion Metrics
Conversion metrics directly tie your content to business outcomes, helping you measure its impact on lead generation and sales.
Lead Generation
Lead generation metrics track how effectively your content attracts potential customers and encourages them to provide their contact information.
To track lead generation:
- Set up form submission tracking in Google Analytics
- Use UTM parameters to attribute leads to specific content pieces
- Implement a CRM system to manage and analyze lead data
Lindsay McGuire of Goldcast emphasises the importance of conversion metrics: “Another huge statistic on my mind is event registrants and attendance, followed by the pipeline [sales leads] generated and attributed from those events.”
Sales Attribution
Sales attribution metrics help you understand how your content contributes to actual revenue by tracking the customer journey from content consumption to purchase. This is the ideal end-goal to prove content works for most marketers – but also the hardest to implement. See our attribution guide further down for some out the box tools that might help.
To set up sales attribution:
- Implement multi-touch attribution modelling in your analytics tools
- Use unique tracking codes for each piece of content
- Integrate your CRM with your analytics platform to connect sales data with content interactions
Tom Whatley of Grizzle provides insight into a simple attribution method: “In terms of pipeline impact, the Grizzle team simply asks new leads where they heard about the agency on the initial call and logs that info into their CRM.”
By focusing on these key performance indicators, you can gain a comprehensive understanding of your content’s effectiveness across various dimensions. This data-driven approach allows for continuous optimisation and improvement of your content strategy.
Step 3: Implement a Data-Driven Content Strategy
TL;DR:
- Learn how to conduct keyword research and analyse competitor content
- Discover methods for creating content based on data insights
- Understand how to validate content ideas using data-driven approaches
Conduct Keyword Research
Keyword research is the foundation of a data-driven content strategy. It helps you understand what your target audience is searching for and how to meet their needs.
Tools for Keyword Research
Start by using keyword research tools to find relevant search terms. Popular options include:
- Google Keyword Planner: Free tool that provides search volume and competition data.
- SEMrush: Offers detailed keyword analytics and competitor analysis.
- Ahrefs: Provides comprehensive keyword data and content gap analysis.
To use these tools effectively:
- Enter seed keywords related to your topic
- Review the suggested keywords and their search volumes
- Export the data for further analysis
Prioritising Keywords
Once you have a list of keywords, prioritise them based on:
- Search volume: Higher volume indicates more potential traffic.
- Keyword difficulty: Lower difficulty means easier ranking opportunities.
- Search intent: Ensure the keyword matches your content’s purpose (informational, transactional, etc.).
Create a spreadsheet to rank keywords based on these factors. This will guide your content creation efforts.
Analyse Competitor Content
Understanding what works for your competitors can inform your own strategy. Here’s how to conduct a competitor content analysis:
- Identify your main competitors using tools like SEMrush or Ahrefs.
- Analyse their top-performing content using these metrics:
- Organic traffic
- Backlinks
- Social shares
- Content length and format
Tools for Competitor Analysis
Use these tools to gather competitor data:
- BuzzSumo: Identifies popular content and influencers in your niche.
- Moz: Provides detailed SEO metrics and link data.
- SimilarWeb: Offers website traffic and engagement statistics.
Identifying Content Gaps
To find content opportunities:
- Look for high-volume keywords your competitors aren’t targeting.
- Identify topics they’ve covered but you haven’t.
- Find areas where you can provide more in-depth or updated information.
Create a content gap analysis spreadsheet to track these opportunities.
Create Content Based on Data Insights
With keyword and competitor data in hand, it’s time to create content that meets user needs and outperforms the competition.
Data-Driven Content Ideation Framework
Follow these steps to generate content ideas:
- List your target keywords
- Match each keyword with a content format (blog post, video, infographic, etc.)
- Outline the main points to cover based on top-ranking content
- Identify unique angles or additional value you can provide
Validating Content Ideas
To ensure your content ideas are worth pursuing:
- Check search trends using Google Trends to confirm ongoing interest.
- Survey your audience, use content feedback tools or analyse customer support queries to validate pain points.
- Create a small test piece of content and measure engagement.
These steps help answer the question, “How do you validate content ideas?” by providing a data-backed approach to content creation.
Content Creation Process
Once you’ve validated your ideas:
- Create a detailed content brief including:
- Target keyword(s)
- Content format and length
- Key points to cover
- Internal and external linking opportunities
- Write or produce the content, focusing on providing unique value
- Optimise the content for SEO, including:
- Title tags and meta descriptions
- Header structure
- Image alt text
- Review and edit for quality and accuracy
By following this data-driven approach, you’re more likely to create content that resonates with your audience and performs well in search engines. Long-tail keywords make up 70% of all search traffic, highlighting the importance of targeting specific, niche topics in your content strategy.
Step 4: Track Content Marketing Effectiveness Metrics
- Learn to monitor search rankings and SERP features
- Measure backlink growth and quality
- Analyse user behaviour to optimise content and prove content works
Monitor Search Engine Rankings
Tracking your content’s performance in search engines is crucial. It helps you understand how well your content strategy works.
Tools for Tracking Keyword Positions
Start by choosing a reliable rank tracking tool. Popular options include:
- Google Search Console: Free and provides accurate data directly from Google.
- Ahrefs: Offers comprehensive keyword tracking and competitor analysis.
- SEMrush: Provides detailed ranking data and SERP feature tracking.
To set up rank tracking:
- Select your target keywords.
- Add them to your chosen tool.
- Set up tracking for your website.
- Choose tracking frequency (daily, weekly, or monthly).
- Set up alerts for significant ranking changes.
Importance of Featured Snippets and SERP Features
Search Engine Results Pages (SERPs) now include various features beyond traditional organic listings. These include:
- Featured snippets
- People Also Ask boxes
- Image carousels
- Local packs
Tracking these features is important because:
- They often appear above organic results, increasing visibility.
- They can drive significant traffic to your site.
- They indicate that Google sees your content as highly relevant.
To track SERP features:
- Use a tool like SEMrush or Ahrefs that offers SERP feature tracking.
- Identify which of your keywords trigger SERP features.
- Analyse the content that’s winning these features.
- Optimise your content to compete for these positions.
Measure Backlink Growth
Backlinks remain a crucial factor in search engine rankings. Tracking your backlink profile helps you understand your content’s impact and authority.
Using Backlink Analysis Tools
Several tools can help you track your backlink growth:
- Google Search Console: Provides basic backlink data for free.
- Ahrefs: Offers comprehensive backlink analysis and historical data.
- Majestic: Known for its large link database and detailed metrics.
To use these tools effectively:
- Set up regular backlink reports (weekly or monthly).
- Track the total number of backlinks and referring domains.
- Monitor the growth rate of new backlinks.
- Identify your most linked content.
Assessing Backlink Quality and Relevance
Not all backlinks are created equal. High-quality, relevant backlinks have a greater impact on your rankings. To assess backlink quality:
- Check the linking domain’s authority using metrics like Domain Rating (Ahrefs) or Domain Authority (Moz).
- Evaluate the relevance of the linking page to your content.
- Look at the anchor text used in the backlink.
- Assess whether the link is follow or nofollow.
- Consider the contextual relevance of the link within the page.
Create a spreadsheet to track these factors for your most important backlinks. This will help you identify patterns in the types of content that attract quality links.
Analyse User Behaviour
Understanding how users interact with your content is crucial for optimisation. It helps you create more engaging content that meets user needs.
Collecting Feedback Through Survey Tools
User feedback provides direct insights to help you prove content works. Tools for collecting feedback include:
- Rockee: Free and easy to set up.
- SurveyMonkey: Offers more advanced survey features.
- Hotjar: Combines surveys with other user behaviour analysis tools.
To effectively use surveys:
- Keep surveys short and focused.
- Ask specific questions about content quality and relevance.
- Include open-ended questions for qualitative feedback.
Heat Mapping
These tools provide visual representations of user behaviour on your content pages. Although they are often hard to read and won’t prove content works. More so, they are useful to help you spot problems in the user experience.
Heat mapping tools like CrazyEgg or Hotjar show:
- Where users click most frequently.
- How far down the page users scroll.
- Areas of the page that get the most attention.
To use heat maps effectively:
- Set up heat mapping on your most important content pages.
- Analyse the results after collecting data for at least a week.
- Look for patterns in user behaviour across different types of content.
Using Insights to Optimise Content Structure
Apply the insights from user behaviour analysis to improve your content:
- If users aren’t scrolling far, move important information higher on the page.
- If certain sections get more attention, consider expanding on those topics.
- If users are clicking on non-clickable elements, consider making those elements interactive.
- Use scroll depth data to determine ideal content length for different topics.
- Place calls-to-action (CTAs) in areas where users spend the most time.
Remember, optimising content is an ongoing process. Regularly review your user behavior data and make incremental improvements to your content strategy.
Step 5: Calculate Return on Investment (ROI)
- Learn how to attribute revenue to content using different models
- Understand how to factor in content creation costs
- Discover ways to present ROI data visually for maximum impact
Attribute Revenue to Content
Connecting your content to revenue is crucial. The ultimate way to to prove content works. It helps you understand which pieces drive sales. Here’s how to do it:
Understanding Attribution Models
Attribution models help you assign credit for sales to different content pieces. There are several types:
- First-touch attribution: Gives all credit to the first content a customer interacted with.
- Last-touch attribution: Assigns all credit to the last content viewed before purchase.
- Multi-touch attribution: Spreads credit across multiple content pieces.
Each model has its strengths. First-touch is good for awareness content. Last-touch works well for decision-stage content. Multi-touch gives a more balanced view.
Setting Up Revenue Tracking
To track revenue, follow these steps:
- Choose your attribution model.
- Set up tracking in your analytics tool (e.g., Google Analytics).
- Create UTM parameters for your content URLs.
- Link your analytics to your CRM system.
- Set up goal tracking for purchases or leads (e.g. form-fill or download)
Bonus tip: If budget permits, look at advanced attribution tools like Hockeystack or Dreamdata. From our experience, using tools like GA4 can be quite challenging to get this right. Simply as they were never built to measure on-site attribution.
Factor in Content Creation Costs
To calculate true ROI, you need to account for all costs associated with content production. This extra step is a big winner when proving to internal stakeholders, that you’re considering the whole picture. Showing ROI of the planning, creation and distribution of content is the most comprehensive way of showing your content is adding value to the business.
Calculating Total Content Costs
Include these elements in your cost calculation:
- Writer/creator fees
- Editor costs
- Design expenses
- Software subscriptions (e.g., SEO tools, content management systems)
- Promotion costs (e.g., paid social media ads)
- Time spent by internal team members
Add all these up for each piece of content or for your entire content strategy over a set period.
ROI Calculation Formula
Use this formula to calculate your content ROI:
ROI = (Revenue attributed to content – Content costs) / Content costs * 100
For example, if your content generated £10,000 in revenue and cost £2,000 to produce:
ROI = (£10,000 – £2,000) / £2,000 * 100 = 400%
This means you earned a 400% return on your investment.
Present ROI Data Visually
Visual representations of ROI data make it easier to understand and share with stakeholders and allow you to prove your content works to the key people in your business.
Creating Compelling Data Visualisations
Follow these steps to create effective ROI visualisations:
- Choose the right chart type:
- Bar charts for comparing ROI across different content pieces
- Line graphs for showing ROI trends over time
- Pie charts for displaying revenue attribution by content type
- Use colour effectively:
- Use contrasting colours to highlight important data points
- Stick to a consistent colour scheme that matches your brand
- Keep it simple:
- Don’t overcrowd your visuals with too much information
- Use clear, concise labels and titles
Tools for Creating ROI Dashboards
Several tools can help you create professional-looking ROI dashboards:
- Google Data Studio: Free tool that integrates well with Google Analytics
- Tableau: Powerful data visualisation software with extensive features
- Power BI: Microsoft’s business analytics tool, good for complex data sets
- Looker Studio: Data platform that can create custom dashboards
Choose a tool that fits your technical skills and budget. Many offer templates to get you started quickly.
By following these steps, you’ll be able to calculate and present your content ROI effectively. This data will help you prove the value of your content and make informed decisions about future content investments.
Step 6: Optimise Content Discoverability
TL;DR:
- Learn on-page SEO best practices for better search visibility and reach
- Understand how to make your content easily findable online
Implement On-Page SEO Best Practices
On-page SEO is crucial for making your content discoverable in search engines. It involves optimising various elements on your webpage to improve its visibility and ranking. Let’s break down the key components:
Title Tag Optimisation
- Keep title tags under 60 characters to prevent truncation in search results.
- Include your primary keyword near the beginning of the title.
- Make titles compelling and click-worthy while accurately describing the content.
Example: “Content ROI: 5 Proven Strategies for Measuring Success”
Meta Description Optimisation
- Write meta descriptions between 150-160 characters.
- Include your primary keyword and a clear call-to-action.
- Provide a concise summary of what readers will find in your content.
Example: “Discover 5 proven strategies to measure content ROI. Learn how to track, analyse, and optimise your content marketing efforts for maximum impact.”
Header Tag Optimisation
- Use H1 tags for your main title (only one per page).
- Structure content with H2, H3, and H4 tags for clear hierarchy.
- Include relevant keywords in headers, but prioritise readability.
Example: H1: Content ROI: Measuring Success in Content Marketing H2: Understanding Content ROI Metrics H3: Traffic and Engagement Metrics H4: Bounce Rate and Time on Page
Internal Linking Strategy
Internal linking is vital for both SEO and user experience. It helps search engines understand your site structure and guides users to relevant content.
- Link to related content within your site.
- Use descriptive anchor text that includes relevant keywords.
- Create a logical site structure with category and tag pages.
Example: In a blog post about content ROI, link to related articles about analytics tools or content strategy using anchor text like “content analytics tools” or “developing a data-driven content strategy.”
Advanced Tips for Proving Content Effectiveness
- Learn how to set up and run A/B tests for content
- Create a content scoring system to prioritise optimisation efforts
- Use data-driven methods to refine your content strategy
Use A/B Testing to Refine Content Strategy
A/B testing is a powerful method to improve your content’s performance. A note of caution for you – It’s only worth applying this to seriously high volume pages, where you already have insight that content attracts an engaged and ideal fit audience.
This process is time heavy and often only with marginal gains. Still keen? Here’s how to set up and run content A/B tests:
Setting Up A/B Tests
- Choose your testing platform:
- Use tools like Google Optimize, Optimizely, or VWO
- Ensure the tool integrates with your content management system
- Select the content element to test:
- Headlines
- Call-to-action buttons
- Images
- Content length
- Create two versions:
- Version A: Your current content (control)
- Version B: The new version with changes
- Define your success metrics:
- Click-through rate
- Time on page
- Conversion rate
- Determine sample size:
- Use an A/B test calculator
- Aim for statistical significance
- Set up the test:
- Use your chosen platform to create the test
- Set the traffic split (usually 50/50)
- Define the test duration
- Launch the test:
- Monitor for any technical issues
- Let it run for the predetermined duration
Interpreting Test Results
After running your A/B test, follow these steps to interpret the results:
- Check for statistical significance:
- Look for a confidence level of at least 95%
- Be cautious of declaring a winner too early
- Analyse the impact:
- Compare the performance metrics of both versions
- Calculate the percentage improvement
- Consider external factors:
- Seasonal changes
- Marketing campaigns
- Industry events
- Document findings:
- Create a report with test details and results
- Include recommendations for future tests
- Implement changes:
- Apply the winning version to your content
- Plan follow-up tests to further refine
- Share insights:
- Inform stakeholders of the results
- Discuss implications for content strategy
By consistently running A/B tests, you can make data-driven decisions to improve your content’s effectiveness over time.
Implement Content Scoring
Content scoring helps you assess the value of your content based on multiple metrics. It’s basically an instant content audit as well if you can implement this. Here’s how to create and use a content scoring system:
Creating a Content Scoring System
- Identify key metrics:
- Traffic (pageviews, unique visitors)
- Engagement (time on page, scroll depth)
- Conversions (leads generated, sales attributed)
- SEO performance (rankings, backlinks)
- Assign weights to metrics:
- Determine importance of each metric
- Allocate points based on impact (e.g., 40 points for conversions, 30 for traffic)
- Set scoring ranges:
- Define what constitutes low, medium, and high performance
- Example: 0-30 points = low, 31-70 = medium, 71-100 = high
- Create a scoring formula:
- Sum of (Metric Value × Weight)
- Example: (Traffic Score × 0.3) + (Engagement Score × 0.3) + (Conversion Score × 0.4)
- Automate the process:
- Use spreadsheets or custom tools to calculate scores
- Set up data imports from analytics platforms
- Establish a scoring schedule:
- Decide frequency (weekly, monthly, quarterly)
- Ensure consistent evaluation periods
Admittedly this is arguably the hardest task to complete, and would likely need the help of a developer or in-house data expert. If you can get a system in place like this, it’s an incredible way of signposting you towards the content on your website that is or isn’t performing. Allowing you to easily prioritise your energy, on key areas e.g. high traffic, low engagement pages are a huge opportunity to optimise.
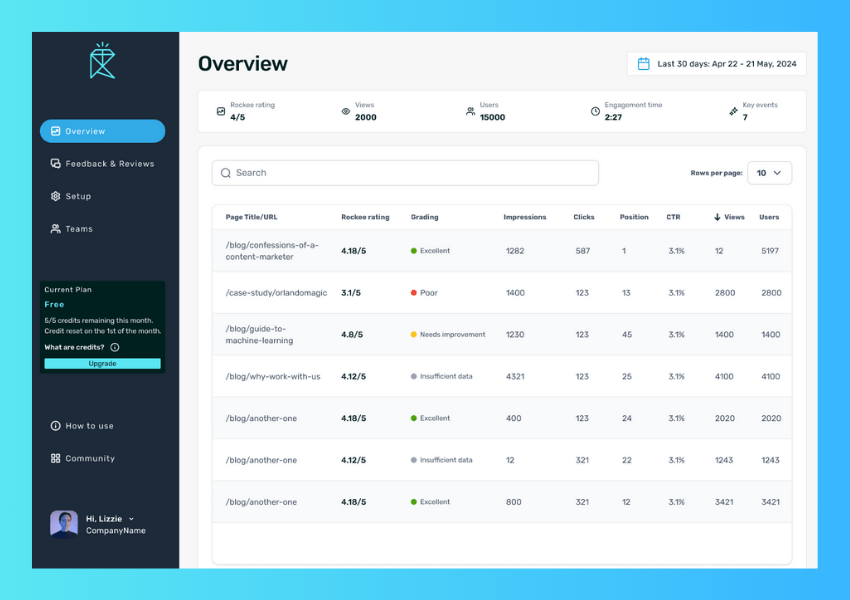
Or better yet, get instant insights using a tool like Rockee which has a built-in content grading system. Just saying!
Using Content Scores for Optimisation
Once you have a content scoring system in place, use it to guide your optimisation efforts:
- Prioritise content for improvement:
- Focus on medium-scoring content first
- Identify specific metrics dragging down the score
- Analyse high-scoring content:
- Determine what makes it successful
- Apply insights to other content pieces
- Make data-driven decisions:
- Use scores to justify content updates or removals
- Allocate resources based on potential impact
- Track score trends:
- Monitor how scores change over time
- Identify patterns in content performance
- Set score-based goals:
- Aim to increase average content score
- Target specific improvements in low-scoring areas
- Refine your content strategy:
- Use insights to inform future content creation
- Adjust your approach based on what scores reveal
- Report on content performance:
- Present content scores to stakeholders
- Demonstrate ROI of content optimisation efforts
By implementing a content scoring system, you create a standardised way to evaluate and improve your content’s effectiveness. This data-driven approach allows you to focus your efforts where they’ll have the most impact.
Common Pitfalls in Content Performance Measurement
- Avoid focusing on vanity metrics that don’t drive business decisions
- Set clear, measurable goals aligned with business objectives
- Use actionable metrics to guide content strategy and improvements
Focusing on Vanity Metrics
Vanity metrics can be misleading, and won’t help you prove content works. Metrics like page views often show large numbers but don’t necessarily translate to business success. The context behind that number is key, presenting that in isolation – raises more questions than answers. Actionable metrics, on the other hand, provide insights that can guide decision-making and improve content strategy.
Ruler Analytics defines vanity metrics as “metrics that make you look good but aren’t indicative of real performance and don’t help you define your marketing strategy.” This highlights the key difference between vanity and actionable metrics.
Examples of vanity metrics include:
- Page views
- Social media followers
- Email list size
While these numbers can seem impressive, they don’t always correlate with business outcomes.
Actionable metrics, in contrast, provide valuable insights:
- Conversion rates
- Customer acquisition cost
- Revenue per customer
These metrics directly relate to business goals and can inform content strategy decisions.
The Problem with Vanity Metrics
Vanity metrics can create a false sense of success. They might show growth, but this growth doesn’t always translate to business value. For example, a large number of page views doesn’t necessarily mean more sales or customer loyalty.
Identifying Actionable Metrics
Actionable metrics should:
- Drive business decisions
- Be reproducible
- Demonstrate clear cause and effect
Eric Ries, author of “The Lean Startup,” says, “Metrics are people, too.” This quote emphasises the importance of understanding the context and implications of metrics, not just the numbers themselves.
To identify actionable metrics, ask yourself: “Can this metric lead to a course of action or inform a decision?” If the answer is no, it’s likely a vanity metric.
Neglecting to Set Clear Goals
Setting clear goals is crucial for effective content performance measurement. Without specific objectives, it’s challenging to determine which metrics matter and how to interpret the data.
The Importance of Goal-Setting
Clear goals provide:
- Direction for content creation
- Benchmarks for success
- Alignment with overall business objectives
When setting content goals, ensure they are SMART:
- Specific
- Measurable
- Achievable
- Relevant
- Time-bound
For example, instead of “increase blog traffic,” a SMART goal would be “increase organic blog traffic by 25% in the next quarter through weekly long-form content publishing.”
Aligning Content Metrics with Business Objectives
To ensure your content efforts contribute to business success, align your metrics with overarching company goals. This sounds obvious, but arguably one of the hardest challenges markers face is proving the value of their work to internal stakeholders. When asking for new budgets, resources or support – having your content performance linked to business objectives, makes your argument all the more compelling.
Steps to align content metrics with business objectives:
- Identify key business goals (e.g., increase revenue, improve customer retention)
- Determine how content can support these goals
- Choose metrics that demonstrate content’s impact on these goals
- Set specific targets for each metric
- Regularly review and adjust based on performance
For instance, if a business goal is to increase customer retention, relevant content metrics might include:
- Repeat visitor rate
- Time spent on site by existing customers
- Email newsletter open and click-through rates for retention-focused campaigns
By focusing on these metrics, you can demonstrate how content contributes to keeping customers engaged and loyal.
Remember, the key to prove content works is to focus on metrics that drive action and align with business goals. By avoiding vanity metrics and setting clear objectives, you can create a content strategy that delivers measurable results and contributes to overall business success.
Tools and Resources to help you Prove Content Works.
TL;DR:
- Free and paid analytics tools offer diverse features for content tracking
- Learning resources help stay updated on content analytics trends
- Choosing the right tools and resources optimises content strategy
Free Analytics Tools
Free analytics tools provide a solid foundation for content performance tracking without straining budgets. These tools offer basic insights into user behaviour, traffic sources, and engagement metrics.
Google Analytics 4 remains the cornerstone of free analytics tools. It provides detailed information on website traffic, user demographics, and behaviour flow. To maximise its use, set up custom dashboards and goals aligned with your content objectives. This allows for quick access to relevant data and easier tracking of key performance indicators.
Another valuable free tool is Google Search Console. It offers insights into how your content performs in search results, including click-through rates and average position for specific keywords. Use this data to identify underperforming content and optimise it for better search visibility.
Maximising Free Tools
To get the most out of free analytics tools:
- Integrate multiple tools for a comprehensive view
- Set up custom reports to focus on key metrics
- Use UTM parameters to track specific campaigns
- Regularly review and adjust your tracking setup
Setting up Google Search Console and GA4 is your best starting point. Many marketers still find extracting meaningful insights from those two platforms, our own research shows it can take up to two days a month trawling through this data to figure out what to do next.
Paid Analytics Platforms
While free tools offer valuable insights, paid analytics platforms provide more advanced features for in-depth content analysis. These tools often offer more granular data, predictive analytics, and integration with other marketing tools.
Rockee, makes sense of your Search Console and GA4 data. Plug those two sources in and get instant content grading, with insight on why that content is or isn’t performing and why. Rockee will also collect user insights and scan your content – which means it can accurately tell you what to do next to improve content engagement.
Ahrefs, for example, provides comprehensive SEO analysis, including backlink profiles and keyword difficulty scores. This helps in understanding your content’s competitive landscape and identifying opportunities for improvement.
Semrush offers a suite of tools for content marketing, including topic research and content audit features. These capabilities allow for data-driven content creation and optimisation strategies.
Determining Investment Value
To assess if a paid tool is worth the investment:
- Calculate potential ROI based on your content goals
- Consider the tool’s learning curve and required resources
- Evaluate integration capabilities with your existing tech stack
- Take advantage of free trials to test features
Remember, the most expensive tool isn’t always the best fit. Choose a platform that aligns with your specific content objectives and team capabilities.
Learning Resources for Content Analytics
Staying updated on content analytics trends is crucial for maintaining a competitive edge. Various learning resources can help you deepen your understanding and skills in this area.
Courses and Certifications
- Google Analytics Academy: Offers free courses on Google Analytics and data analysis
- HubSpot Academy: Provides content marketing and analytics certifications
Books on Content Analytics
- “Content Chemistry” by Andy Crestodina: Covers content strategy and measurement
- “Data-Driven Marketing” by Mark Jeffery: Focuses on using data for marketing decisions. An oldie but a goodie.
Customising Your Analytics Stack
Creating an effective analytics stack requires a mix of tools tailored to your specific needs. Start with free tools to start to prove your content works, then gradually incorporate paid tools as your content strategy evolves.
Consider these factors when building your stack:
- Content types (blog posts, videos, social media)
- Distribution channels
- Business goals
- Team size and expertise
- Budget constraints
Regularly reassess your tools to ensure they still meet your needs as your content strategy grows and changes.
Data Visualisation for Content Performance
Effective data visualisation is key to understanding and communicating content performance. Tools like Google Data Studio, Rockee or Tableau can help create insightful dashboards that prove content works by blending data from various sources.
When creating visualisations:
- Focus on key metrics aligned with your goals
- Use appropriate chart types for different data sets
- Ensure clarity and simplicity in design
- Include context and benchmarks for better understanding
Leveraging AI in Content Analytics
Artificial Intelligence is increasingly playing a role in helping prove content works. Tools like Rockee can provide content grading, predictive insights and offer personalised content recommendations.
Examples of AI applications in content analytics:
- Predictive analytics and content grading for content performance
- Natural Language Processing for sentiment analysis – based on user feedback
- Personalised content recommendation engines
While AI offers powerful capabilities, it’s important to maintain human oversight to ensure accuracy and relevance in your content strategy. There’s still some areas that need that personal touch, and if I’m honest that bit of gut instinct of a good content marketer at times.
Data-Driven Content: Prove content works for your business
Content marketing doesn’t have to be guesswork. Nearly everything can be backed by numbers. By tracking the right metrics, you can prove content’s value and refine your strategy. Remember: set clear goals, choose the right KPIs, and consistently analyse your data.
Ready to turn your content into a powerhouse? Start by implementing one new measurement technique this week. Which metric will you focus on first to demonstrate your content’s impact?