
10 Essential Content Marketing Metrics and How to Use Them

One complicated question we (often) need to answer – as content marketers – is the role our content plays in driving conversions.
We’re aware it does, but explaining ‘how’, is usually difficult.
John Bonini’s post perfectly captures why we find it so. Understanding the process takes time, and isn’t 100% perfect.
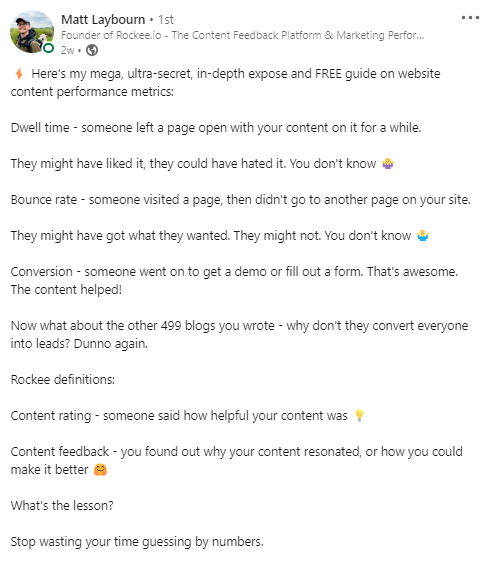
(Source)
Content marketing metrics help by giving us an idea, while content feedback helps us understand the ‘why’ behind the numbers. This post will cover 9 qualitative and 1 quantitative metric you should use for in-depth content analysis.
10 Content Marketing Metrics to Track
- Search Impressions
- Traffic
- Keyword Rankings
- Click-Through Rate
- Views
- Engagement
- Engagement Rate
- Engagement Time
- Scroll Depth
- Event Count
- Conversions
- Content Feedback (Qualitative Metric)
From Google Search Console
1. Search Impressions
A search impression is the number of times a URL from your website appeared in a user’s search result. To view search impressions in Google Search Console, choose your website, and click on Performance:
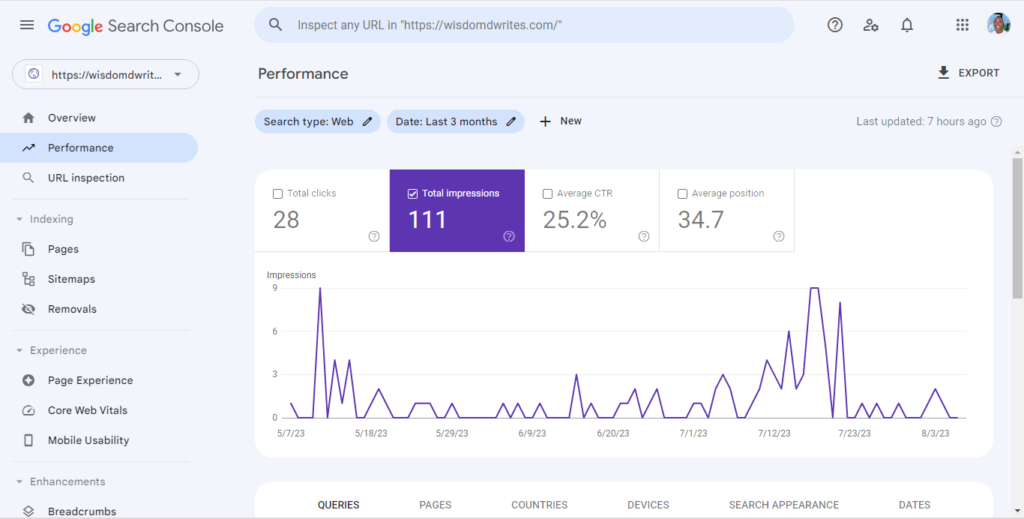
“Impressions clarifies how often our content appears in search results and how frequently it’s clicked on. This helps us to understand the visibility and appeal of our content in search results.”
Aaron Gray (CEO of Pursuit Digital)
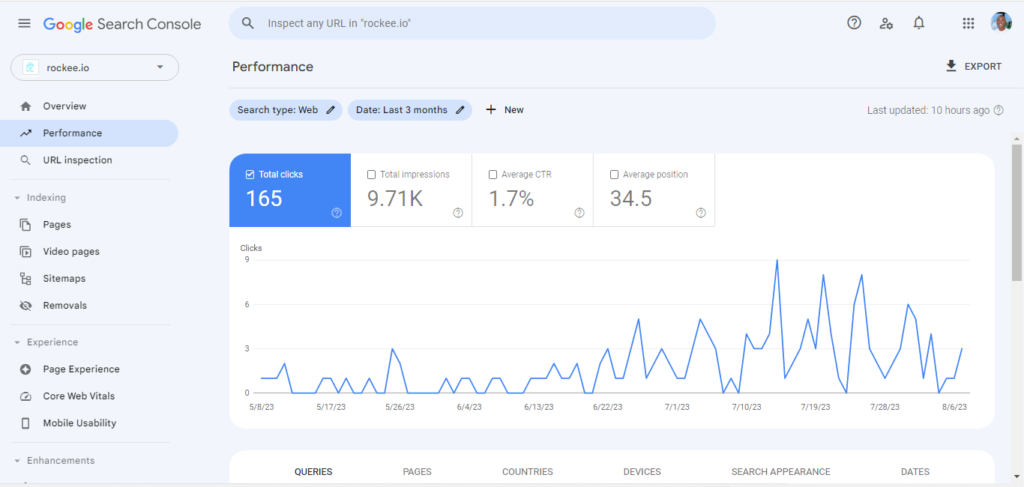
2. Traffic
This metric measures the number of visitors to your website. Go to Google Search Console > Performance > Total clicks to see your website’s traffic. To see website Traffic within a set period click on Date.
3. Keyword Rankings
Keyword rankings refers to how well your website ranks for certain keywords or queries. To view keywords your website currently ranks for in Google Search Console, check Performance, scroll down, and select Queries.

“We have a list of keywords that we try to rank our content for, and we track them using Semrush. However, I often go to Google Search Console to check what keywords my content is actually ranking for. Sometimes it could be that a blog post ranks for a keyword that is not explicitly mentioned in it, and adding this mention can help it rank better”.
Alex Perekalin (Content Manager at Mouseflow)
4. Click-Through Rate
Your website’s click-through rate is the ratio of clicks on a particular link on your website, to the total number of website visitors you had within a period. According to Backlinko, the average CTR for search is 1.91%, while a website CTR greater than 3% is considered good for SEO.
Go to Google Search Console > Performance > Average CTR to see your website’s average click-through rate. For example, Rockee’s website has an average CTR of 1.7%.

To see the CTR of individual pages, scroll down and select
How to calculate your website’s Click–through rate
If your website had 1,000 impressions and 200 clicks in January, your website’s CTR for that month is:
CTR = (Clicks/Impressions) x 100%.
CTR = (200/1000) x 100% = 0.20 x 100%.
CTR = 20%
This means out of 1,000 impressions, only 20% of them resulted in clicks.
From Google Analytics 4
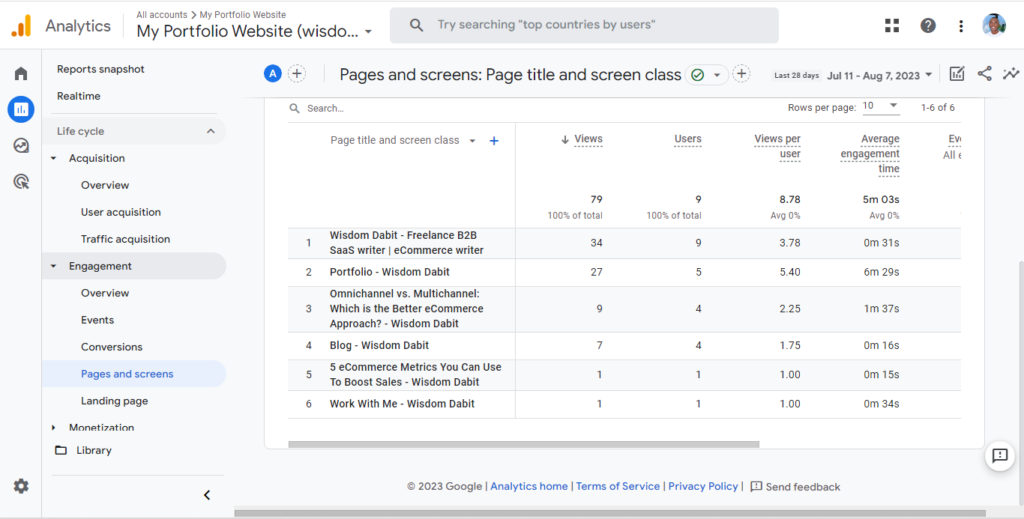
5. Views
Formerly known as ‘Pageviews’ in Universal Analytics, ‘Views’ instead refers to the total number of times a webpage was viewed by users. Just like in Universal Analytics, repeated views of a single page are counted.
To see ‘Views’ in GA4, head over to Reports > Life cycle > Engagement > Pages and screens
Engagement
Engagement Rate
Engagement rate in GA4 is the percentage of engaged sessions on your website. This metric measures how visitors interact with your website’s content.
In the left-hand menu, choose “Acquisition” from the “Reports” section then click “User acquisition” to see your website’s engagement rate.

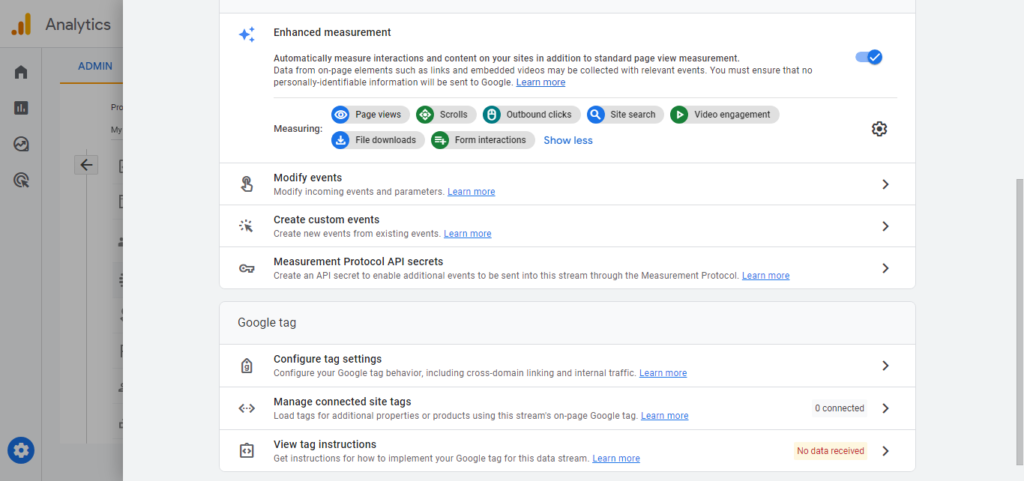
Tip: Turn on enhanced measurement to capture video engagement as visitors view embedded videos on your site. To measure video engagement on your site using GA4.
- Click Admin. Ensure you are in the correct account and property.
- In the Property column of the current account, click < Data Streams > Web
- Under Enhanced measurement, slide the switch On to enable all options including Video engagement by default.
“GA4’s Engagement Rate digs deeper to determine the depth of engagement users have with your content. Like an audience applause meter, this metric helps you better understand if they find your post helpful, relevant, and engaging.”
Emily Onkey (Co-founder and CMO of Aplós.)
Average Engagement Time
This metric tells you the average time a web page was viewed by a user. Average engagement time tells you how well the content on your site engaged visitors.
To view your average engagement time, head to Reports > Life cycle > Engagement > Overview.

On my website, for example, the average engagement time is 5 minutes 41 seconds.
“It’s such a simple thing for a customer to just click on a website, but it’s a whole other thing for them to not only remain on the page, but to continue scrolling to where they’ve become a prospective customer. Think about your tendencies — how often do you mindlessly click on a webpage only to back out almost immediately?”
Erin Banta (Co-founder and CEO of Pepper)
7. Scroll Depth
Scroll depth in GA4 tells you how far visitors scrolled a page. By default, GA4’s scroll event is triggered when a visitor scrolls 90% of a webpage. To ensure the ‘Scrolls’ event is turned on:
- Click Admin in Google Analytics.
- Make sure you are in the correct account and property.
- In the Property column of the current account, click Data Streams > Web.
Under Enhanced measurement, check to see if the slide is switched On and the ‘Scrolls’ event as well. To be sure, Click ⚙️.
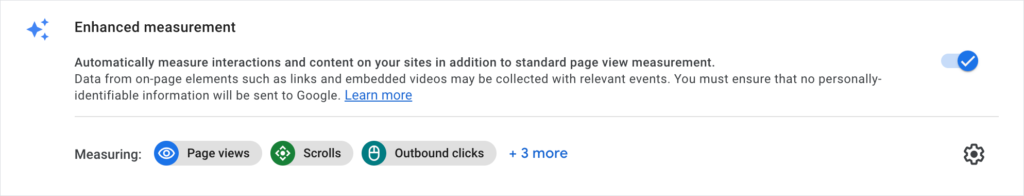
If the ‘Scrolls’ event is turned on, it’ll look like this:

You can set up custom scroll depth tracking to know more, such as how many users scrolled through 50% or 75% of the page.
“Using GA4, I track how far users are scrolling on our pages. This metric provides insights into whether the content is engaging enough to hold readers’ interest. It’s crucial in formulating layout strategies and placing impactful content at suitable points”.
Abhi Bavishi (Growth Marketer and Entrepreneur at Abhi Bavishi)
8. Event Count
An event count is the number of times a visitor triggered a set event. The Event count by Event name card in the real-time report shows each triggered event and the number of times visitors triggered each on your website. Click an event to see all event parameters that were sent with it.
By default, Google Analytics automatically counts events having the following parameters:
- language
- page_location
- page_referrer
- page_title
- screen_resolution
TIP: Turn on enhanced measurement (See #7 above) to collect ‘Enhanced measurement events’ like:
- Page views
- Scrolls
- Outbound clicks
- Site search
- Video engagement
- File downloads
- Form interactions
To access the events report in GA4, follow the following steps: Click on Reports > Engagement > Events. Scroll down, and you’ll see the complete list of logged events in your GA4 reporting view.
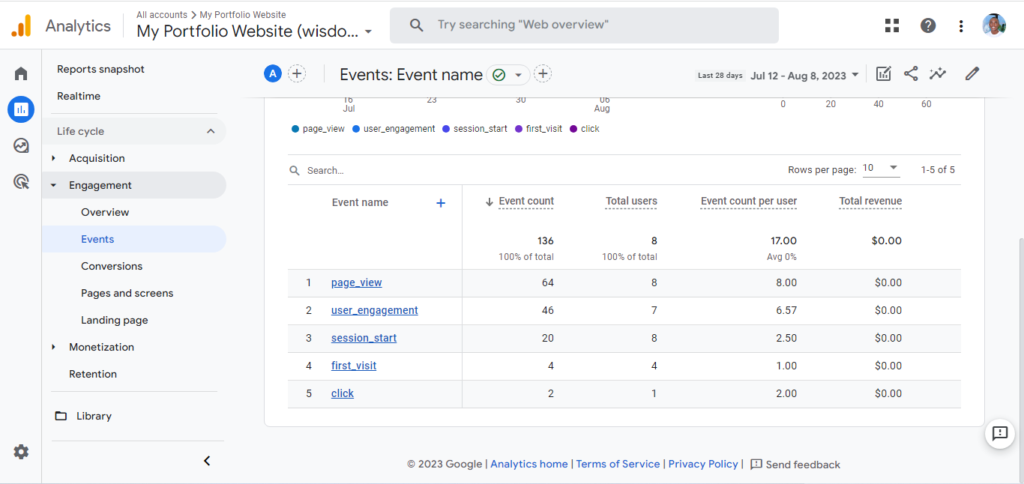
Each event’s total count will be shown under the ‘Event count’ metric, with your website’s total event count at the top.
“GA4 allows content marketers to define custom conversions based on specific ‘Events.’ So rather than looking at page views, you can measure vital actions such as newsletter sign-ups, app installations, or purchases as one Event. This data will provide insights into the number of conversions, conversion rates, and other metrics related to the specific event you’re tracking. It’s an easier way to track and analyze the metrics that align with your goals.”
Jas Banwait Gill (Growth Manager at SwagMagic)
9. Conversions
Conversions measures the number of times users triggered an event that’s considered valuable to your business. It’s also up to you to decide what counts as a conversion by customizing.
On our website, for example, a conversion is when a visitor begins a signup.
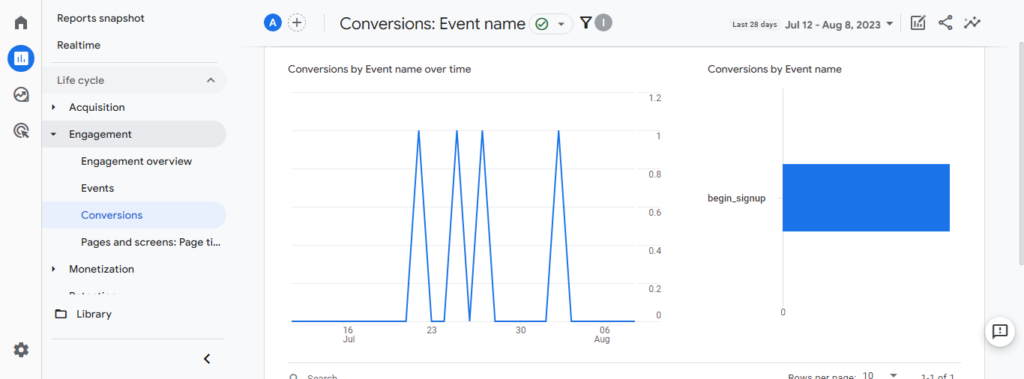
To access conversion in GA4, Click on Reports > Engagement > Conversions.
“It’s important to understand the conversions related to particular content pieces. We look at how many leads or customers a particular content material asset generated. This aids in the discovery of content material that plays well and at once supports our income funnel”
David Reid (Sales Director at VEM Tooling)
Qualitative Metrics
10. Content Feedback
Content feedback is simply information from visitors about content on your website.
Qualitative feedback is amazing because talking to your readers will give insights that data from other tools can’t.
For instance, if a reader tells you I’m a marketer – and I enjoyed reading your post because of the real-life examples you gave in your content, and then supplied feedback on what can improve further – it becomes easier for you to know:
- A marketer actually read your content.
- What they liked about it.
- Ways you can create better content.
With Rockee, you get content ratings, can set customizable questions, and also a feedback box for blog readers to share what they liked/disliked about the post.
Here’s what Alex Holliman, the MD at Climbing Trees had to say about Rockee:
“Rockee has been on our site for ages now, it’s still really fast and the data we are building up about our content and more importantly who is looking at it, proves invaluable.”
Get content feedback >>>>>
Readers can tap on the widget at the side (just like the one on this post) to rate content and give feedback.

Or do so at the end of the content.

2 Problems With Most Metrics
- Understanding what works from most metrics is difficult because content teams won’t know if it resonated – especially if readers don’t convert.
- Users don’t buy after reading every article – so you need a better way to understand if your content solved the users’ problem or what they searched for.
The Solution
Rockee’s content ratings feature allows you to combine normal metrics from SEO and analytics tools to understand the ‘why’ behind the numbers.
The feedback collected tells content and SEO teams:
- what the user’s experience is in real terms, not just numbers and guesswork.
- If the content resonated or not.
- how they can improve content (if they need to).
- why content is so popular – helping them plan to recreate/repurpose it in the future.
And yes, you can try Rockee by rating this content below 👇, and telling me what you liked about this post. (You’re basically taking a demo, just that you won’t see the back end without signing up 😉).
Want to get feedback on your website’s content? Try Rockee’s free plan.
FAQs
>What are content marketing metrics
Content marketing metrics are benchmarks used for measuring content performance.
What are the main KPIs for content marketing
The main KPIs for content marketing are:
- Resonance
- Impressions
- Traffic
- CTR
- Conversions
Why are content marketing metrics important
Content marketing metrics are important because they help in analyzing content performance. They tell the impact and effectiveness of your content efforts.
Why should I use audience feedback to optimize content?
For many, the main objective is to optimize for SEO. However, the subsequent challenge lies in guaranteeing that your content is compelling enough to captivate and encourage your readers.
Content that fails to resonate merely generates empty traffic. Your current responsibility is to address audience issues, provide education, and offer inspiration.
With Rockee, you now have a measure of how well your content is doing.